Wednesday, April 5, 2017

Market Has Largest One Day Reversal Since February 2016

Reality Begins to Sink In


  • Stocks lose this morning's gains to finish lower after the hawkish tone in the FOMC minutes, which also showed that some Fed officials are worried about high equity valuations.
  • Today, the market had the largest one day reversal since February 2016
  • Paul Ryan made matters worse by stating that tax reform could take even longer than healthcare
  • TLT is up over 4% since we targeted a buy level in our previous article

Valuations Are Still Insanely High


Market Outlook

The S&P 500 is at somewhat of a pivot-point that could break either way. We are waiting for a significant break of either trend line indicated on the daily chart below to confirm the direction. The short term momentum is currently down, but this seems to be the bull market that never ended. 


The S&P weekly chart below also indicates we are due for a retracement. We expect the move lower to happen if price breaches the 50 day moving average. We are currently targeting a move to 2250-2275. This is mostly reliant on if we break support as well as how quickly we decide to move lower. A slow move down would make the 2275 more probable. Of course, this all depends on a break of the trend line indicated in the daily chart above.


Regardless of which direction price breaks, we remain long term bearish until valuations return to a "normalized" level. History tells us the 10-year annual return on valuations with a P/E above 20 are not good. In fact, some savings accounts almost have better annual returns than equities when valuations are this high. (charts below)


Conclusion

We remain highly cautious in this market. As we wrote in our previous quarterly outlook, there has been a lot bet on President Trump's ability to follow through. As predicted, we are already seeing the effects of some policies not making it through. The failure of Obamacare Lite and now the statement on taxes made by Speaker Ryan are slowly tightening the noose around this long bull market. Lastly, the Fed will most likely continue raising rates as quickly possible as inflation has more than tripled since July of 2016. All this put together, we get ourselves a nasty storm setting up. We remain long TLT as a hedge for the possible (and statistically probable) upcoming turmoil.

Disclosure: We are long TLT.

Disclosure: The information provided in this article is not to be construed as investment advice. Any securities you buy are ultimately your decision. Investing carries risk. Always do your due diligence before buying/selling any security. We are not being compensated for writing this article.

Saturday, March 11, 2017

I Want to Start Investing. Where Do I Even Begin? - Part 1: The Importance of Saving

I Want to Start Investing. Where Do I Even Begin?


Part 1: The Importance of Saving


          "I want to start investing. Where do I even begin?" These two sentences are something most of us say to ourselves at some point in our lives. From knowing how much money to start with, knowing what kind of account to open up, and knowing what a stock even is, there is a mass amount of information that can seem overwhelming to a new investor. This often discourages most people from attempting to manage their own money. I believe, for those who have the want to take on this feat, it is a very liberating feeling to be able to have direct control of your financial future. It is also rewarding to watch your wealth grow as you stick with it. I won't be able to provide you with every detail, but I will cover as much as I can.

This first article of many is going to cover the VERY first place one would need to start: that is knowing priorities and how to save and allocate money from work.

Priorities

The number one rule of investing is to not lose money. This can happen in many different ways. It can happen from buying a bad company's stock. It can happen from gambling on penny stocks. One way it can happen may not be so obvious. 

Priority #1 - Employer Matched Accounts

One way of losing money is not taking advantage of opportunities right in front of us. Many times, employers will offer matching contributions to a 401(k) or 403(b) (if you are unsure of what these are, we will go over different account types in a future article.) Ask your employer if they have a 401(k) plan with matching contributions. If your employer doesn't offer this, you do not have to worry about this. If your employer DOES offer this, pay attention to what I am about to tell you. If your employer offers matching contributions for a retirement account, you need to be maxing out whatever they match. Let's say they offer 100% matching contributions up to 3% of your income. You need to be contributing ALL 3% of that income. Why? This is an automatic 100% gain on your investment! If you are making $40,000/year, 3% would mean you should be contributing $1,200. This is crucial. If your employer is matching that, you just made an extra $1,200 on your initial investment!

Priority #2 - Savings

Pay yourself FIRST. The first bill you need to pay is your savings or retirement account. This should be treated as a non-negotiable bill. This may seem counter-intuitive, but study after study shows that making sure you have a safety net/nest egg reduces stress, keeps you disciplined on your budget, and helps build your wealth tremendously over time. If you are participating in matching contributions, paying yourself first would technically be the second place to allocate your money. The common response that comes up is, "What if I need to pay my bills?" If you are only making enough income to cover what I call essential spending (rent/mortgage, utilities, phone, gas, food, etc), then this would be understandable. Anything that is not an absolute necessity does not count. If you can only save 5% due to ESSENTIAL spending, save 5%. A common rule is to set aside at least 10% of your paycheck every payday, but you really need to save a minimum of 20% of your income.


Accessibility to your savings may also be important. Of course, you have your traditional savings accounts, checking accounts, savings bonds, and Certificates of Deposit as a means to stow away money. But, most of these options are inconvenient should an actual emergency occur. One option would be to use an Aspiration Summit Checking Account. This company provides a checking account that pays you up to 1% annual interest on accounts with $2,500 or more, 0.25% annual interest on accounts with less than $2,500, has no ATM fees worldwide, no service fees, no minimum balances or monthly deposits, and is FDIC insured. The interest that can be made in this account is greater than the majority of checking and savings accounts provided by other banks. The best part - it is highly accessible because it is a checking account. The only inconvenience would be that this is an online-only bank. You can still set up direct deposit with your employer, have paper checks sent to you, and also deposit checks through their mobile app. This checking account provides you with a place to hold cash without it completely decreasing in value due to inflation. To sign up for an account, just go here


Priority #3 -Essential Spending

The third priority should be to set aside exactly what you need for all of your essential spending. If you pay rent/mortgage, set that aside. If you have a car payment, set that aside. Utilities, cellphone, Internet, you should already know what you will have to pay each month. Fixed expenses should never cause a problem with a budget. You should also know how much you spend per month on food and gas, which are not fixed expenses. You can use a site/app like Mint to track your spending habits and set your budget.


After you have an average for your food and gas, set a budget for it slightly higher (e.g. $190 average per month on food would mean a $200 budget), and do NOT go over it! This should apply to all variable expenses that are considered essential. Examples of essential spending include: food (not dining out), gas, personal care (razors, shampoo, soap, makeup, etc), home supplies (paper towels, dish soap, detergent, etc), and essential clothing (work clothes, socks, underwear, etc.) It is important to set a budget for each of these expenses. This allows you to know exactly where your money is going each month and allows you to stay financially stable. 


Use the 20/50/30 rule to determine if you need to generate more income. The 20 part refers to your savings by using 20% of your income. The 50 part refers to the essential spending of your income using 50% of your income. The 30 refers to all other expenses using the remaining 30% of your income for this portion.


Priority #4 - Debt

Debt is not always a bad thing. Debt allows us to purchase a home, purchase a car, go to college, and build our credit scores. However, letting yourself be consumed by debt can ruin any one's financial goals. I'm not here to teach you how to get out of debt (this is a series about investing.) What I can tell you is this, after you have done the first 3 steps above, its time to start prioritizing debt. Some debt carries interest that a typical investment cannot keep up with. If you got stuck with a 10-15% on a car loan, for example, it does not make sense to put your extra money into investments. Paying off your car should be the priority due to the interest. You should still pay yourself first! Debt should only take priority after you have contributed to an employer-matched 401(k) (if applicable), saved at least 20%, and set aside enough for your essential spending. The one exception to this rule is if you have saved enough for a 6-month emergency fund - that is - enough saved up to fund your budgeted essential spending. If you look at the picture below, you can see the effects of debt interest.


Priority #5 - Pleasurables

Most people aren't robots and need some form of joy in life. If you have met all the priorities before this one, now it's time to enjoy yourself. The remainder of your income is okay to be spent on pleasurables. This can range anywhere from dining out, going to a movie, or buying a new gaming console. While I am somewhat of a robot and would prefer to save more than the 20% minimum of my income, I understand the importance of living a little as well. It is perfectly fine to do these things. 

The problem occurs when we don't pay ourselves first and live paycheck to paycheck, when it really isn't necessary. 69% of Americans don't even have $1,000 in savings. This is a HUGE issue and one of the reasons I am starting this article series. As you can imagine, something as simple as car trouble or getting sick can throw a major wrench in some one's financial situation, especially if they don't even have $1,000 saved. I understand that sometimes it just isn't possible to save even $1. I was in that situation for the majority of my life. For those in that situation, I hope you are able to find a way to start paying yourself first. Getting a second job, working overtime, and getting education/certification are the best way you can get out of that situation.


Ben Shapiro (a Harvard Law School graduate) is gifted at using statistics to give very informative (and often controversial) speeches. One statistic he uses often applies to this article in particular. It states that as long as you can do the following 3 things, you only have a 2% of landing in poverty while having a 74% chance of being in the middle class: 

1. Graduate from High School. 
2. Don't get married until after your 21st birthday, and don't have kids until you are married.
3. Have a full-time job.

Because of this, I believe the majority of those 69% of Americans have the ability to pay themselves first. 

Summary

The goal of this article is to emphasize the importance of saving your hard earned money. We need to take advantage of opportunities if available, such as employer-matched retirement accounts. We need to understand saving is as important as essential bills. A simple 20/50/30 rule can help you determine where you stand with financial stability. When saving, only debt can justify allocating your minimum of 20% savings to paying off your debt (after your emergency fund is set up.) We also need to learn that we don't have to be robots when it comes to saving money. 

Now that I have gone over priorities and income allocation, you are ready for the next step to investing.


Disclosure: The information provided in this article is not to be construed as investment advice. Any securities you buy are ultimately your decision. Investing carries risk. Always do your due diligence before buying/selling any security. We are not being compensated for writing this article.


Thursday, March 9, 2017

WTF Chart of the Day

WTF Chart of the Day


The "WTF Chart of the Day" belongs to the $DJIA weekly chart. Over the course of this 8-year long bull market, the Dow has not been this over-extended above the 50 week moving average since the recovery phase after the Great Recession. This is the second longest bull market in history to put that in perspective.

Each time the index has been this over-extended, there has been a significant retracement that follow (as indicated on the chart below.) This most likely won't happen over night, but it is likely to come over the next couple months. Rate hikes are coming starting next week, valuations are sky-high, and the debt ceiling will have to be dealt with this month. We recently wrote an article on a risk-aversion approach using TLT here


Disclosure: The information provided in this article is not to be construed as investment advice. Any securities you buy are ultimately your decision. Investing carries risk. Always do your due diligence before buying/selling any security. We are not being compensated for writing this article.

Tuesday, March 7, 2017

S&P Hits 100 Trading Days Without a 1% Decline

S&P Hits 100 Trading Days Without a 1% Decline


KEY LEVELS TO WATCH (S&P):

Daily Support - 2,300-2,325 (watch the 50 day moving average)
Long-term weekly support - 1,990 (watch the 200 week moving average)
Short-term weekly support - 2,225-2,250
 (near the 200 day moving average)
First major support and possible bottom should a bear cycle occur - 1,550


100 Days

It was October when we last experienced a -1% close on the S&P. That was one rate hike ago, one president ago, and now, about 5 months ago. This is nearly breaking a 21 year-old record. When was the last time we saw a streak like this? It happened once just before the housing bubble burst, and before that, during the tech bubble. Looking at the chart below, we can see that we are likely due for the streak to end relatively soon. 

The March Rate Hike

The Federal Reserve will be having their meeting next week, and it is highly probable that they will go ahead with raising interest rates for the second time in 3 months. Value Walk did a great article recently in regards to rising rates. (The article also reiterates much of what our quarterly market outlook stated.)

"Do you remember Edson Gould?  He was a legendary technical analyst from the 1930s through the 1970s and developed a simple rule about Federal Reserve policy that has an excellent record of foretelling a stock market decline.
The rule states that “whenever the Federal Reserve raises either the federal funds target rate, margin requirements or reserve requirements three consecutive times without a decline, the stock market is likely to suffer a substantial, perhaps serious, setback” (Schade, 2004). This simple rule is still relevant. Although it tends to lead a market top, it is something that should not be disregarded.
In the mid-1980s the great Marty Zweig wrote a book titled Winning on Wall Street.  He is quoted, “Monetary conditions exert an enormous influence on stock prices. Indeed, the monetary climate – primarily the trend in interest rates and Federal Reserve policy – is the dominant factor in determining the stock market’s major direction.”
Zweig’s Fed policy rule is simple, “three steps and a stumble.”  Basically, when the Fed raises interest rates three times, the stock market stumbles.  When they lower rates, it’s good for stocks." - ValueWalk 
Janet Yellen cooking up circuit breakers

Is a Sell Off Coming Soon?

Does this mean we are about to have a significant sell off? Highly doubtful. If we look at the history of any correction, there were telegraphed moves that displayed prominent weakness in the market. For example, back in August 2015, not only did we have a couple days of -1% and -2% losses while breaking the 200 day moving average, we also had failed to make a new high 3 different times over the course of May-August. 

This does not mean we should get complacent here. We believe the S&P will retrace back to a support level. The daily chart below shows a reasonable -1.5% retracement from the current level is likely. 


The weekly chart below helps us gain perspective on the larger picture. Should the red trend line break (indicated on the daily chart above), we feel a significant support level will be around the 200 day moving average/50 week moving average. The weekly support levels are much more significant.


History Tells Us - Valuations Matter

Lastly, we need to be realistic about our investments. Investing in the equity market while it is at valuations similar to the current level has never produced a significant gain over 10 years. In fact, the average gain per year is only about 2% when valuations have be close to this high in the past. (illustration below) Another issue to note, this is the highest Shiller CAPE we have seen outside of the tech bubble and just before black Tuesday. Let's look at the monthly chart below. We have a clear support level should we enter a bear market. We believe the current risk/reward ratio does not justify any long term investments in the equity market currently. Please read our post on TLT here to see where someone may park their money until we are at a fair valuation. 


Summary

Clearly, right now is a high risk time to begin long term investments. We encourage investors to stay prepared. We have a rate hike next week. The market is in a frenzy of panic buying. This will eventually wear off. When it does, maybe the grim reality of the steep premiums investors have been paying will stop them cold in their tracks. Until that day, pay attention to any short term support levels for short term entries, get defensive with your long term accounts, and don't fall into the trap of the fear of missing out.

Disclosure: We are long TLT.


Disclosure: The information provided in this article is not to be construed as investment advice. Any securities you buy are ultimately your decision. Investing carries risk. Always do your due diligence before buying/selling any security. We are not being compensated for writing this article.


Sunday, March 5, 2017

Long Term Treasury Bonds and the Effects of Rising Interest Rates

Here at Perceptive Investment Research, we continue to receive a lot of questions about interest rate hikes and the bond markets. Common thought is that when the Federal Reserve raises interest rates, the bond will falter and drop in value. Today we're going to look at iShares 20+ year treasury bond ETF, which trades under the ticker symbol TLT.


The weekly TLT chart above shows that the Federal Reserves rate hike on 12/16/2015 had little effect on TLT, instead of falling, TLT instead rose to an all time high of $143.62. Now could this have been baked into the price of TLT after years of the Federal Reserve not raising rates after the financial crisis of 2008-2009? Possibly. After TLT reached it's all time high, it retreated heavily over a period of almost a year. A few Federal Reserve officials stated that they expected that they would raise 2-3 times in 2016. They only raised once. The talk from the Fed officials expecting 2-3 rate hikes in 2016, likely spooked bond traders and TLT tumbled. The second rate hike in a decade was on 12/14/2016 and TLT did retreat to a 52 week low of $116.80 but did not fall further and started regaining footing in the coming days. Twice now, when the Fed raised rates, TLT did not plunge. It's likely that in both instances that the rate hike was baked into the price of TLT and that was the root cause of only minor reaction.

Debt Ceiling

The debt ceiling is fast approaching once again. If you look back to 2011 and 2013 after Congress agreed to raise the debt ceiling, TLT took off. If Congress once again raises the debt ceiling this March, look to TLT to continue on it's long term trend upwards. The United State government is unlikely to default on bond obligations:


Bear Market Performance


The 2008-2009 bear market was during one of the greatest economics crisis' since the Great Depression of 1929 and was caused by the housing bubble. Many people lost their jobs, retirement savings and homes. The performance of TLT from late 2007-2009 is astonishing if you look at the chart above. As equity prices started to come back at the end of the bear market, TLT retreated. For diversification purposes, especially if we start a bear market, having TLT could prove beneficial to your portfolio.

Current Outlook on TLT


Our current outlook on TLT is bullish. The chart above shows strong daily support and accumulation around the $118 to $119 level. Accumulation typically signals a strong demand for a security around a certain price level. TLT is also oversold on the Full Stochastic indicator. Prior oversold levels ended with TLT rallying. Even if the Federal Reserve raises interest rates, we expect the high demand area of $118-$119 to hold as support. The long term trend of TLT is up according to the weekly chart below: 

We believe TLT will continue it's long term trend up and in the event of a bear market, it will see significant inflows. It's oversold position and strong accumulation on the daily chart signal a move up, regardless of what the Fed does in March. The debt ceiling decision is likely to have an effect as well. A pull back to the horizontal support level of $116 is possible before continuing the trend up. TLT, since inception has never fallen below it's 200 Weekly Moving Average. That feat on it's own is quite astonishing. According to TLT History, if you were to put $10,000.00 in TLT on 03/05/07 and leave it there until today, while reinvesting the dividends, you would now have $18,286.18 if in a tax sheltered account such as a Roth IRA. The compound annual growth rate or CAGR is 6.22% with a total return of 82.86%. There is a leveraged version of TLT with the ticker symbol TMF.

UPDATED CHARTS:

DAILY CHART
______________________________________________________________________

WEEKLY CHART
_______________________________________________________________________

MONTHKY CHART
________________________________________________________________________

Disclosure: We are long TLT.

Disclosure: The information provided in this article is not to be construed as investment advice. Any securities you buy are ultimately your decision. Investing carries risk. Always do your due diligence before buying/selling any security. We are not being compensated for writing this article.

Monday, February 27, 2017

All Bull Markets Must End Badly - This One Is No Different

All Bull Markets Must End Badly - This One Is No Different
Summary

  • A Trump presidency, albeit drama filled, is great for the economy.
  • The debt ceiling is approaching fast.
  • The Dow keeps chugging along; longest streak of record highs in over 30 years.
  • Interest Rates and China.
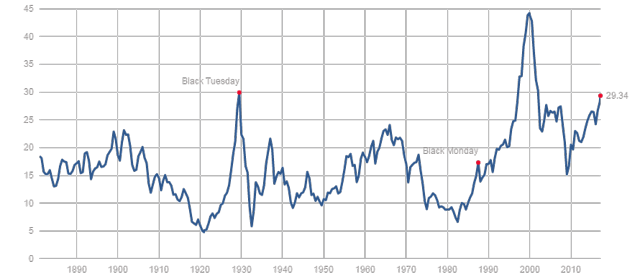
  • Valuations - At only 2 points in history has valuation been higher.

Today, we are going to talk about a few different topics. We haven't given much time to posting about macro views, so we will express our concerns here in the next few paragraphs (we promise it will be worth the read!).
It's time to be cautious. We said in a previous post we were no longer going to talk about the reasons to be bearish. Well… We lied. It is simply impossible to ignore the elephant in the room. It gets frustrating for those being constantly told "This is it. This is the top," or "Stay cautious. Right now is a scary time" We fully understand how one can begin to ignore similar posts. We understand how someone can cry wolf one too many times. Although these are all common issues for bearish analyses, does it make any sense to become complacent because someone's timing is off? Absolutely not. The minute you lose the reality of the data being presented is the same minute you open your account to find the market has tanked.
Those who have followed us since 2015 know we successfully called the November 2015 top, the January and February 2016 bottom, the gold bottom (twice) (also the most recent top), and many successful stock picks such as Western Digital (NYSE:WDC), Strayer Education (NASDAQ:STRA), Flowers Foods (NYSE:FLO), Methanex (NASDAQ:MEOH), and so on (these posts can all be found at www.facebook.com/PerceptiveInvestment). That being said, we were obviously wrong about our call for a possible market top in June 2016. Our analysis led us to believe with the effects of Brexit and the upcoming election, we would begin experiencing sell offs. We were right about the Brexit sell off, albeit briefly. However, we have been baffled at the rally that followed. Does this mean we are wrong about our analysis? Not at all. We are simply wrong on timing (something no one can truly predict.) The election of Trump was something seen as statistically improbable. Now, we need to re-analyze what his election truly means.
Let's get to it.
The President Trump Effect
There is no denying the drama that has surrounded President Trump since even prior to the primaries. Most of media sources have been digging their own graves. Does any of that really matter? If the president can avoid any major scandals, we can ignore the noise. Let's talk about policy, which is what really matters.
Going over the Executive Actions, the first is regulation. President Trump has frozen all pending regulations. He has also introduced a "two out, one in" method for creating any new regulations. Regulations have decimated businesses over the last 8 years. This is a large part of the lack of GDP and earnings growth. Now that businesses are no longer going to be handcuffed, this should improve the economy.
The second Executive Action to acknowledge is the doing-away of the TPP. The TPP would hurt the US more than help. Its goal is to tie the United States to as many trade partners as possible. However, the deal hurts US workers, would lose the US millions of manufacturing jobs, and it would do nothing to fix our trade deficit. There were many other issues as well with the TPP, and the US dodged a bad deal on this one.
The third Executive Action to discuss is the approval of the Keystone and Dakota Access Pipelines. Although there was a lot of noise and drama surrounding DAPL, the emotional rhetoric behind it was substantiated by very little logical reasoning. The pipelines are a great economic boost and will help push the United States to energy independence. Not only that, the pipelines are GOOD for the environment, much to people's disbelief's. The reason being - the pipelines provide a means of transporting oil that is much safer than other means. A study done by the state department during President Obama's term showed that it was MORE dangerous to the environment to transport via barge or rail than it is via pipeline.
The fourth executive order that will provide a boost to the economy is the repealing of the ACA (aka Obamacare.) As with anything, there are pros and cons. The intentions of Obamacare were never ill-advised. There are many great benefits for those who can use it like: the preexisting condition law, expanded Medicaid to those who were just outside of the qualifications, and it increased the amount of Americans on health insurance. Sure, all this seems great, but at what cost? The cons GREATLY outweighed the pros. Small businesses have been decimated due to the costs, premiums have doubled and tripled for millions of Americans who now cannot afford to see a doctor, millions of people had their private insurance CANCELED because the insurance companies could not meet the requirements (what happened to "you can keep your doctor?"), those who didn't purchase insurance were taxed (most likely because they could not afford it in the first place), and it has put a strain on the healthcare system. Personally, I am a United States Marine Corps veteran. I would advise anyone who is pro-ACA to come with me to a VA appointment. The reality is: socialized medicine is detrimental to economic growth and quality of care. A brief example of my experience with the VA urgent care: I needed to be seen due to a severe flu. I wanted to make sure I had no infections developing due to the fact I recently had teeth pulled as well. In a nearly empty waiting room, I sat for 45 minutes to be called back. My first thoughts were "Well at least now I can get treated and go home to lay back down." NOPE. I joined a Vietnam-era vet who had cracked a rib falling down and had an elbow profusely bleeding and an elderly lady who couldn't sit up straight due to being so dizzy. An hour goes by…Not one word from a nurse or doctor. Another hour… A nurse finally shows up to look at the old man. He had already been examined with x-rays and simply needed to be treated. The nurse bandaged his elbow, gave him a prescription for pain, and told him he was free to leave. The old man was clearly still concerned about his ribs. The response to him was "just take it easy next time and avoid strenuous activities for a few weeks." I couldn't believe the lack of concern. Another hour passes and finally, I am told to go to an examination room. Another 30 minutes pass… A nurse knocks on my door and then says, "Oh, I'm so sorry. We thought you were treated already. Let me go get the Nurse Practitioner." Another 15 minutes pass… A different nurse comes in to give me a flu shot and a prescription. I asked, "So… Is that it?" It was. After hoping for a quick treatment, I had been at the VA for over 4 hours for something that took all of 5 minutes. I would NEVER wish government provided healthcare on ANYONE. Is it the personnel's fault for the bad quality? I would say partially, but the root cause is the bureaucracy and hiring process done by the government. The repeal process of the ACA will help alleviate many of Americans' struggles financially, including businesses, as well as their quality of care in the future.
obamacare
The fifth Executive Action has to do with taxes. Although President Trump has not signed anything into action, it is being anticipated that he will soon. His plan is to cut the corporate tax rate from 35% (highest in the world when comparing 1st world countries) to 15%. When President Reagan cut taxes, GDP ended up growing at a rate of over 4%. President Obama never saw above 3% annualized GDP growth, which makes him the first president since Hoover to do so badly. We can be naïve and make excuses and say the president has very limited power. However, that is simply not true when it comes to policy agendas. The president can do a lot when he pushes an issue, which is exactly how Obamacare was passed. President Trump has also announced he wants only a 10% flat tax for the repatriation of companies' cash overseas. Should this happen, companies could bring billions of dollars back into the United States, which would help provide and economic boom. The extra cash can be used to buy new supplies/buildings/etc, be spent on research and development, and overall help create more opportunity for innovation within the United States. Think of Apple (NASDAQ:AAPL): Apple has a whopping $200 BILLION overseas. Imagine what that cash could be used for here in the US!
Is the President Trump Effect enough to keep us going? Possibly. Now that we have identified what looks to be the reason behind this parabolic rally since November, we can now give ourselves a dose of reality by looking at the bigger picture.
The Debt Ceiling
On March 15, congress will have to deal with our biggest nation threat: the DEBT. We are at $19.9 trillion currently and FAST approaching the $20 trillion marker. Why does this matter? Well, usually it wouldn't. This time IS different. The reason being, this is the FIRST time since WWII that our debt has overcome our GDP (currently 104% of GDP). The thing is, this time, we don't have a multi-country war of millions of men costing trillions of dollars worldwide. Instead, we have a world full of debt-ridden countries just one bad disaster away from default.
debt ceiling
Dow Jones Hits Record Close 11 Days in a Row
Late day panic buying sent the DJIA into a frenzy, which resulted in the longest record streak in over 30 years. On top of this, the S&P 500 and DJIA have not seen a down day of 1% or more in over 3 months! Is this sustainable even in the best of economic times? Is the economy truly worth 12% more than it was in November? I don' believe so. We believe any benefit of Trump's presidency has been baked in over the last few months. The only way to justify the rate of return even possibly continuing would be if something happens as dramatic like Trump's election results. The market was generally overvalued already. We are now at the point of euphoria.
dow jones industrial average
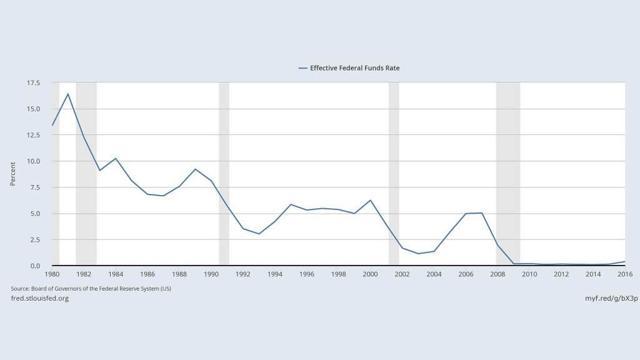
Queen Yellen and Interest Rates
The Fed currently has a 73% probability for raising rates in March. I am personally ecstatic about the idea. Not because I like when the market implodes due to Yellen crying wolf 1 or 937859 too many times. I am ecstatic because we might actually get to a point where we don't have to live in fear of negative rates, worthless currency, and a broken financial system. Okay, maybe the last point won't happen, but the raise of rates has been needed TERRIBLY. Rates have not been lower and not nearly as low this long in more than a half century. We did what we had to do in 2008/2009 to prevent a world collapse. I do NOT believe we did the right thing in the years following. I believe the FED has induced an asset bubble once again. The FED has too much on their books, and the US taxpayer will eventually pay the consequences.
Federal Funds Rate
Federal Funds Rate
China
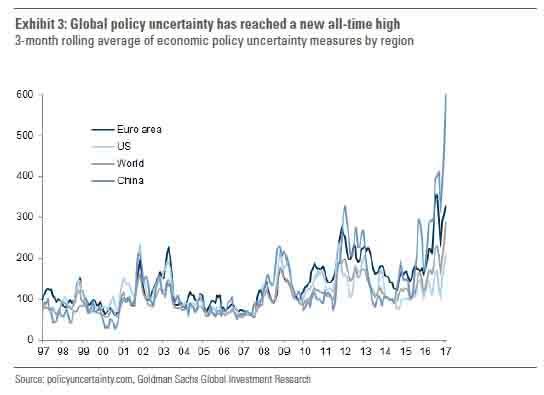
How is it possible that China, which is seemingly far more "concerning" at this moment than it was a year ago when fears about Chinese financial conditions and devaluation led to global market selloff and pushed the S&P into correction, has had virtually no impact on risk assets so far in 2017? Either the uncertainty data is wrong, or the market is WILDY wrong. It is hard to say the impact President Trump will have on our relationship with China, but we can say it is concerning.
China
Last but Most Importantly: Valuations
An article was put out back in July 2016 about how companies like Alphabet (NASDAQ:GOOG) and Amazon (NASDAQ:AMZN) are so disruptive, we need to think of different valuation metrics to judge them. What I take from this is: Valuations no longer matter because we can't measure the impact of disrupting companies. While this is true, Amazon and Alphabet are dominate, what matters are top and bottom lines. It is pretty hard to justify investing in a company whose P/E ratio was over 950 less than 2 years ago. Yes, Amazon can do something like move into online banking or the like and disrupt even more, but why would we ignore valuations over speculation? Top and bottom lines are what make a company a good investment, not speculation on prospects. That isn't to say we should ignore future prospects, either. The main point here is this: We absolutely need to worry about valuations.
The 12 big cap techs of 2000 (led by Microsoft (NASDAQ:MSFT), Dell , Intel (NASDAQ:INTC), and Cisco (NASDAQ:CSCO) saw their combined valuation soar from $900 billion to $3.8 trillion in the 48 months leading up to the March 2000 peak. They plunged to just $875 billion a decade later. Their market cap was reduced by nearly 80%! How are the long term investors of Microsoft from 1998/1999 fairing? It took them 14 years to make a return on investment excluding dividends! Not only this, their accounts were devoured by inflation.
When 2015 ended, the four fabulous fang stocks of Facebook (NASDAQ:FB), Amazon, Netflix (NASDAQ:NFLX), and Alphabet gained $500 billion of market cap while the remaining 496 companies in the S&P 500 went DOWN by more than $500 billion. We are talking about 4 companies that essentially kept the market afloat and kicked the bear market farther down the road. Amazon has a current P/E of 172, is trading at 41 times its free cash flow, is worth 20 times its book value, and has had little to no profit margin in the past few years. This isn't meant to be a swipe at Amazon (I actually love the company and its prospects). This is just a reality check.
stock market valuations
Summary
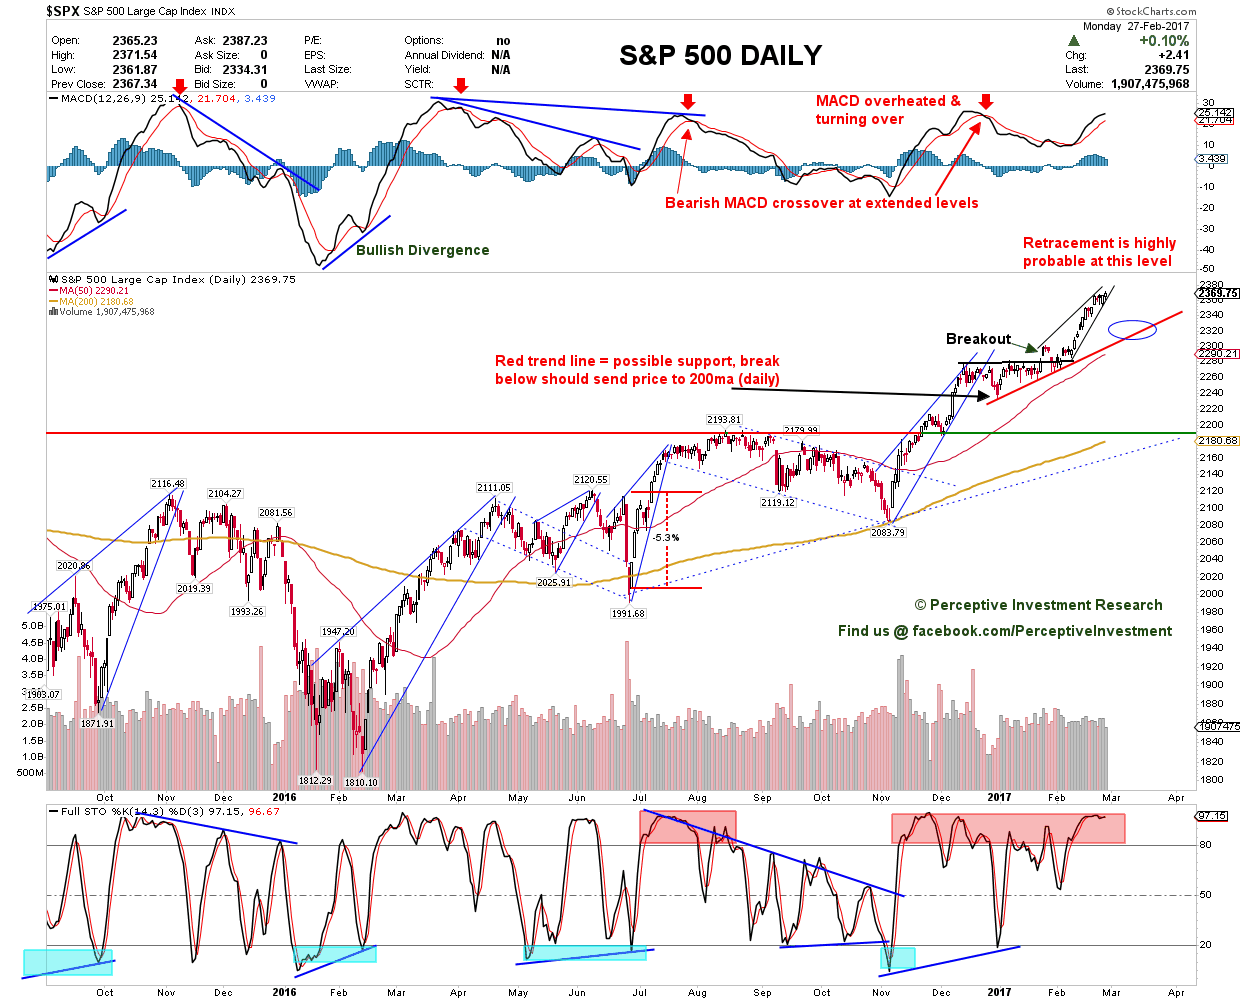
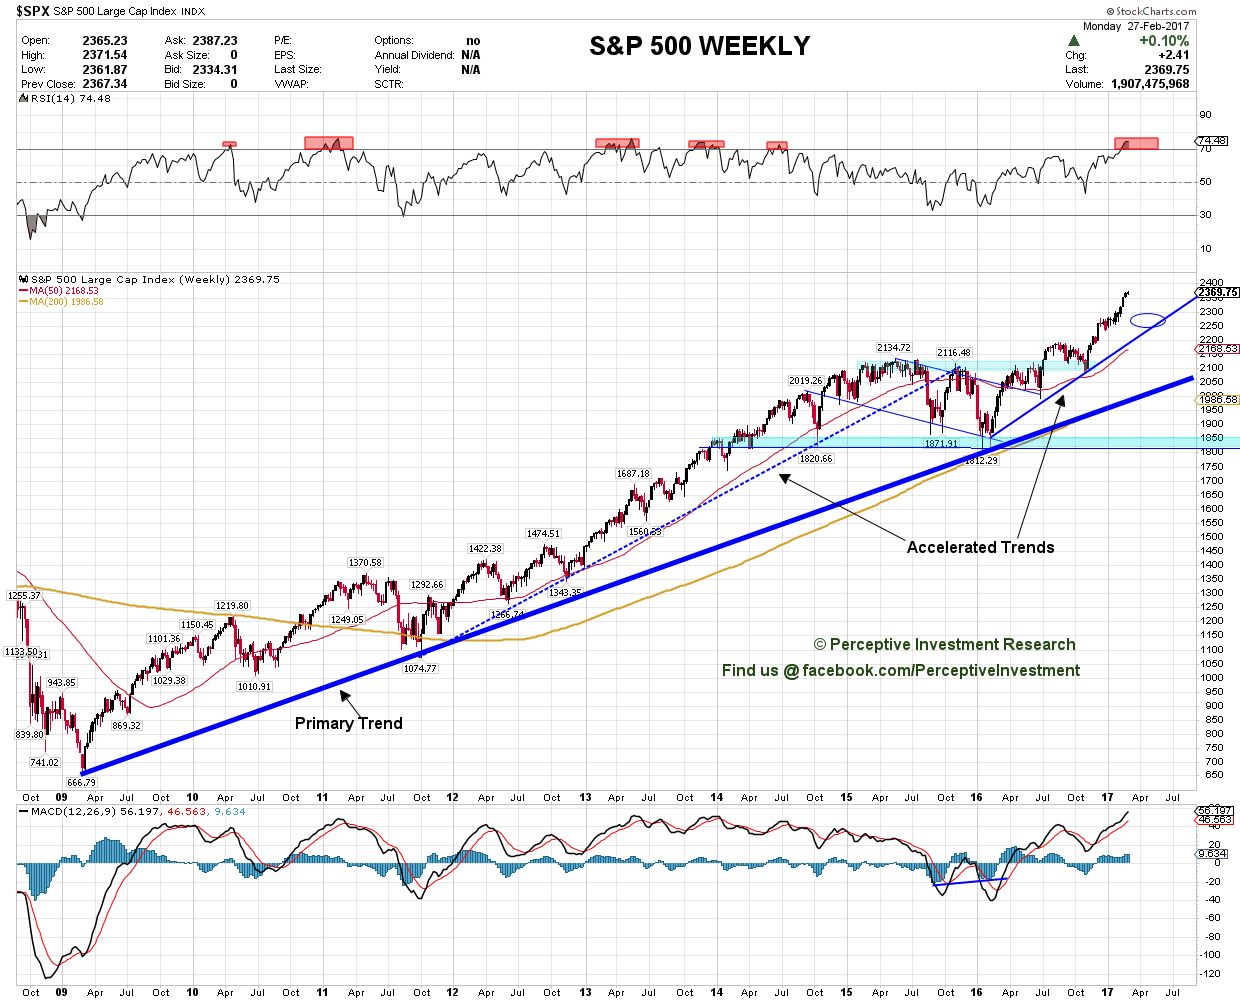
In summary, we believe the market is destined to see a bear market in the near future. We fully believe we are on an unsustainable path. In the short term, we may see a small retracement towards some kind of support level (indicated on the charts below.) Longer term, our view is that the US economy will see growth, but unfortunately, that speculated growth has been baked into the current market prices. We believe it is more of probability than a possibility that the US stock market will experience its first bear market since 2009 within the next couple years. As Benjamin Graham says: "All bull markets MUST end badly." The longer the bull market, the steeper the fall. This is now the second longest bull market on record. We will be watching for a break of the "primary trend" as indicated on the weekly chart below. It's going to end, so be cautious.
s&p 500
s&p 500
Disclosure: I/we have no positions in any stocks mentioned, and no plans to initiate any positions within the next 72 hours.
I wrote this article myself, and it expresses my own opinions. I am not receiving compensation for it (other than from Seeking Alpha). I have no business relationship with any company whose stock is mentioned in this article.